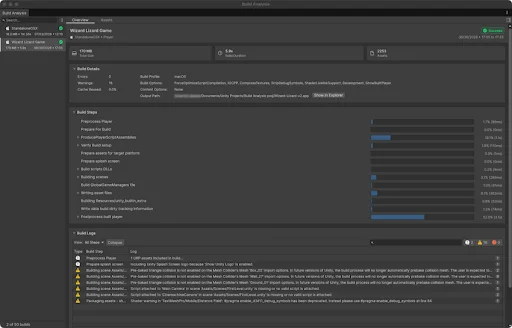
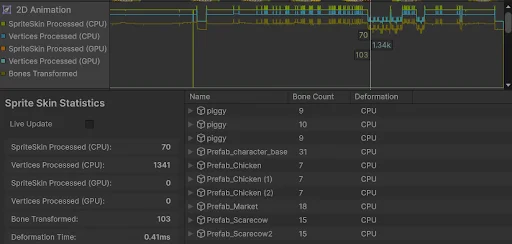
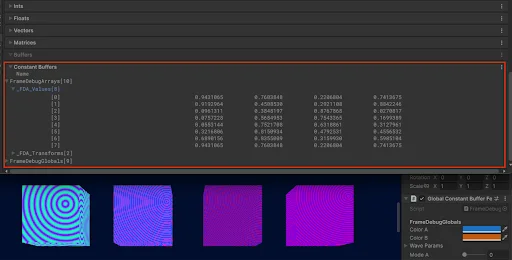
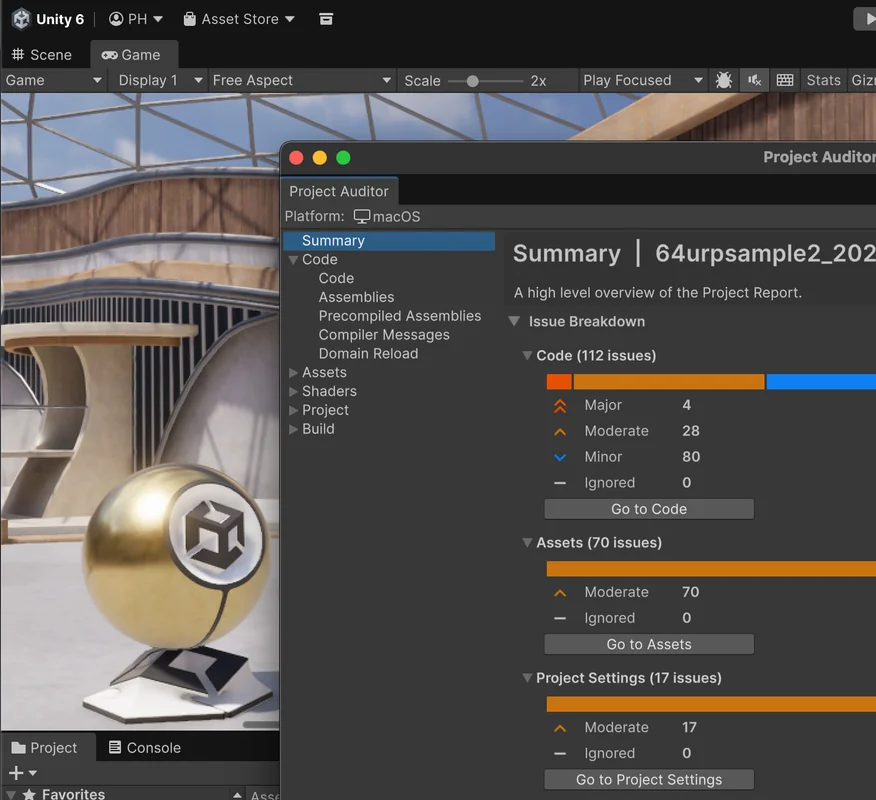
Inspect rendering detailsFrame Debugger exposes more shader data to help investigate visual problems.
Unity Manual Measure GPU Resident Drawer activityUnity’s 6.6 guide shows what the new Profiler view reports about coverage, culling, and timing.
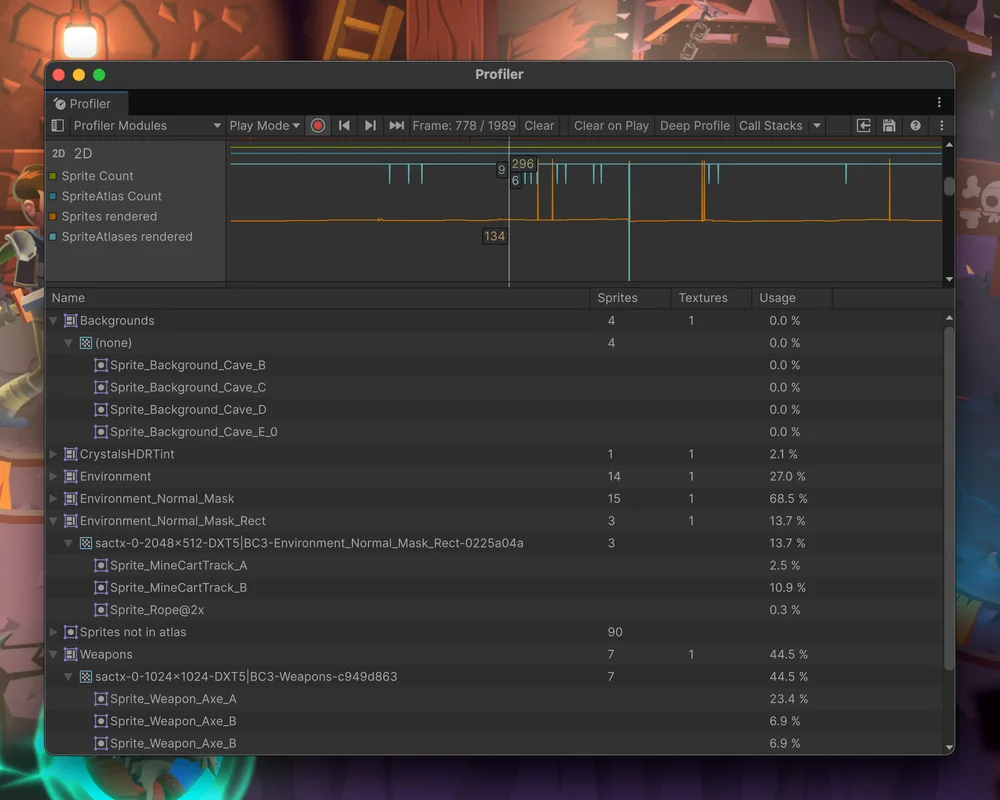
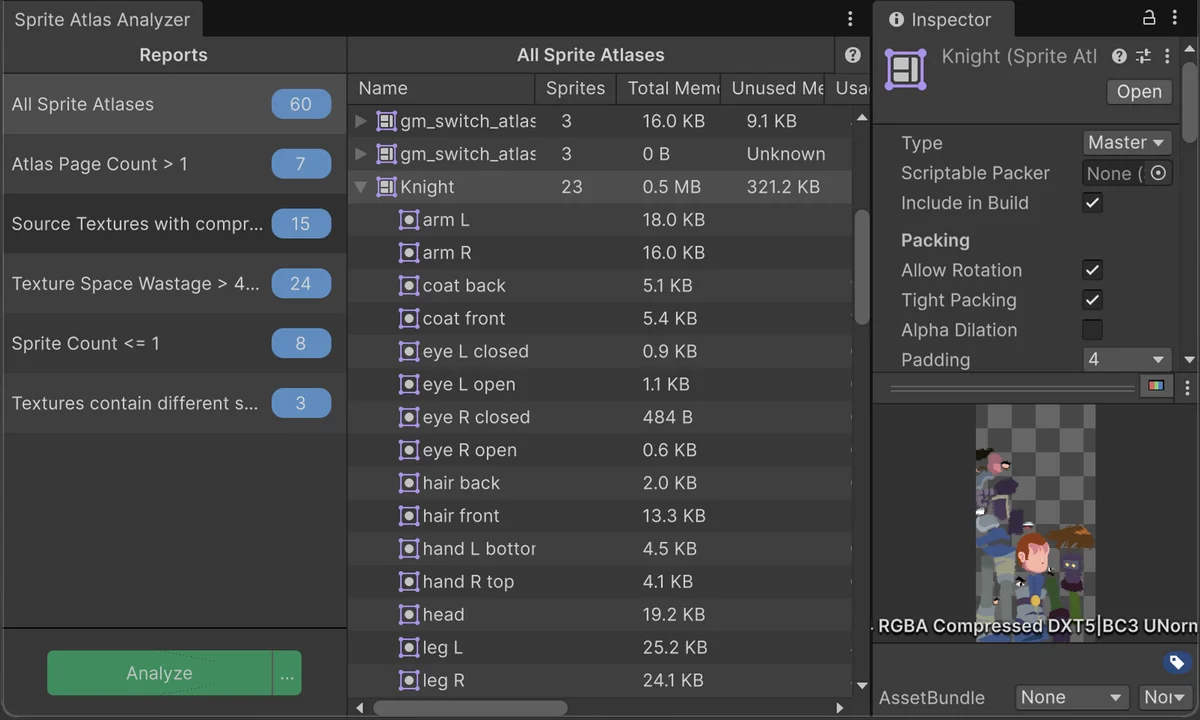
Unity Manual Track sprite counts and atlas use in the ProfilerFind where the new 2D module reports sprites and which atlases were used in a frame.
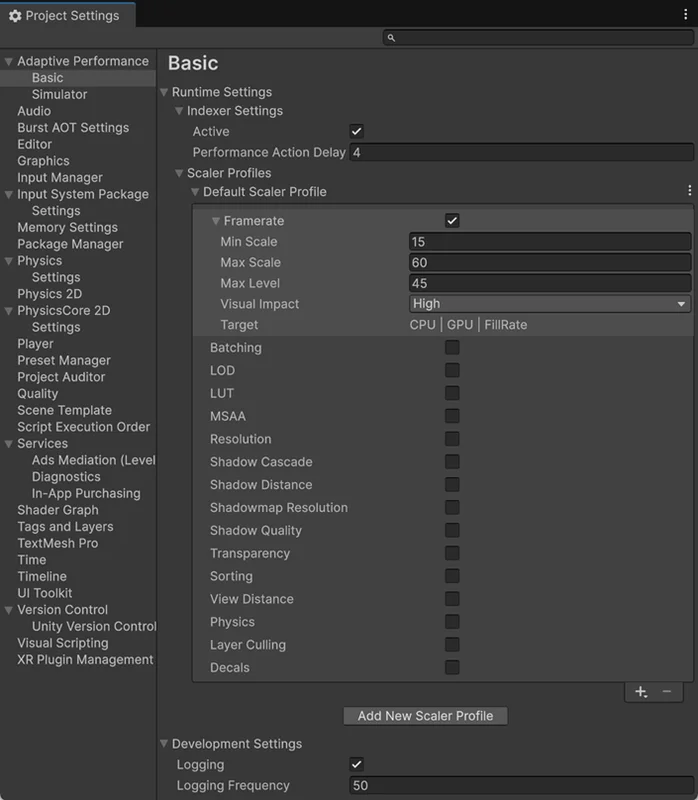
Console quality scalingAdaptive Performance expands its basic provider to PlayStation and Xbox platforms.
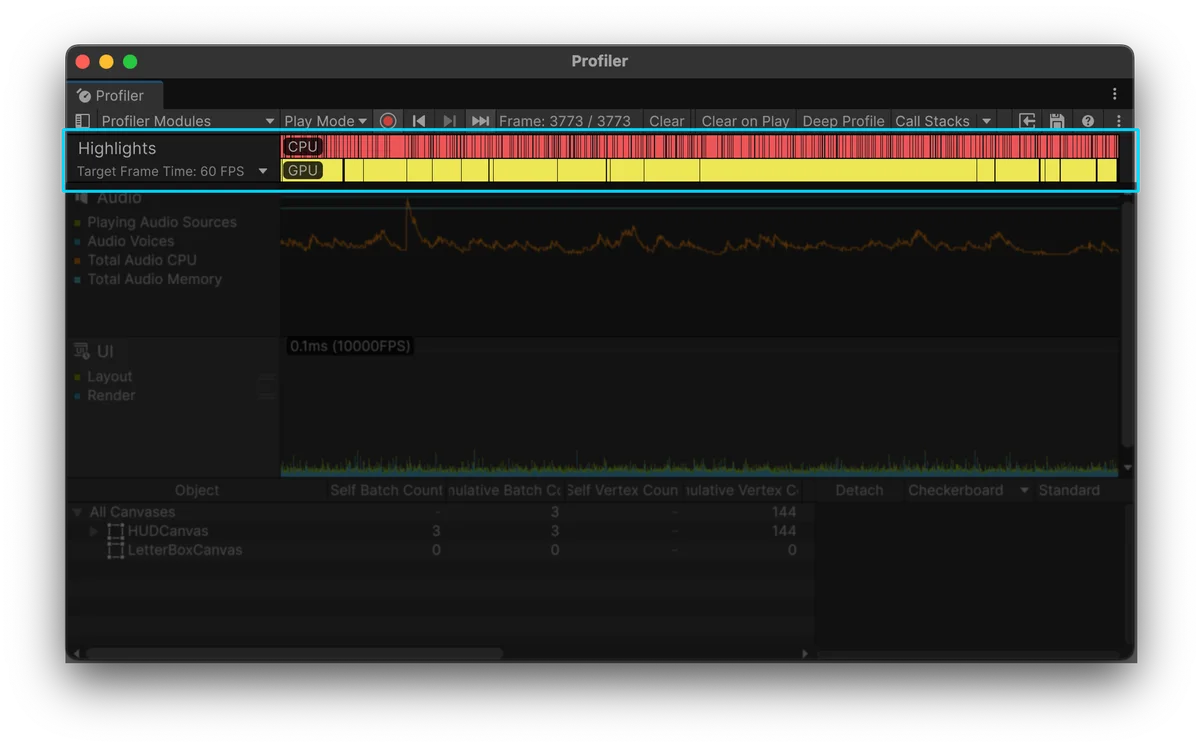
Unity Manual Read the Highlights Profiler moduleUse the overview to find expensive frames and see whether the CPU or GPU is taking longer.
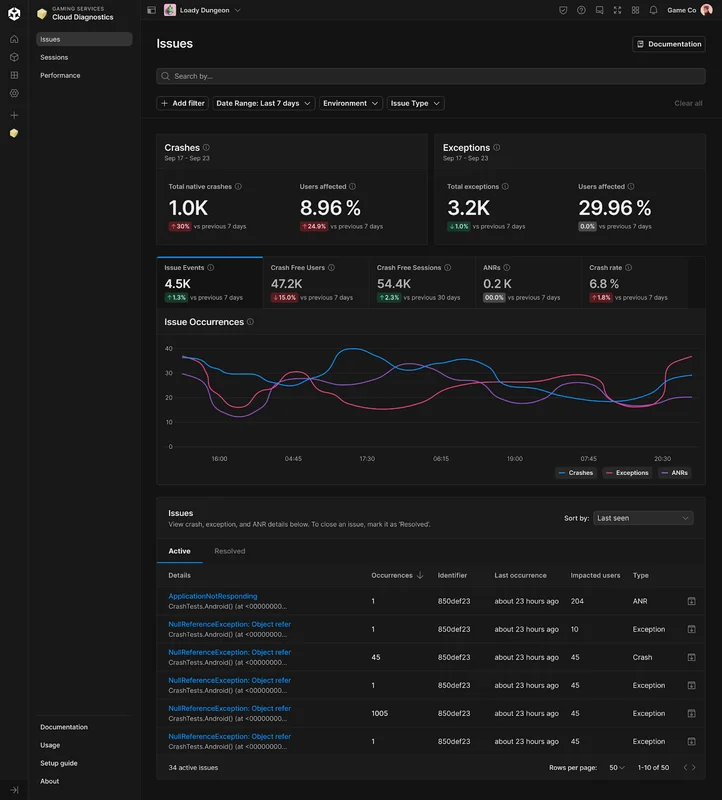
Unity Discussions Investigate crashes and Android freezes in Unity DiagnosticsUnity’s team explains the new Dashboard reports, including app-not-responding events and session details.
Unity Resources Unity’s profiling handbook for Unity 6Published during the 6.1 release cycle, this Unity 6 handbook covers profiling frames, memory, and power on target devices.
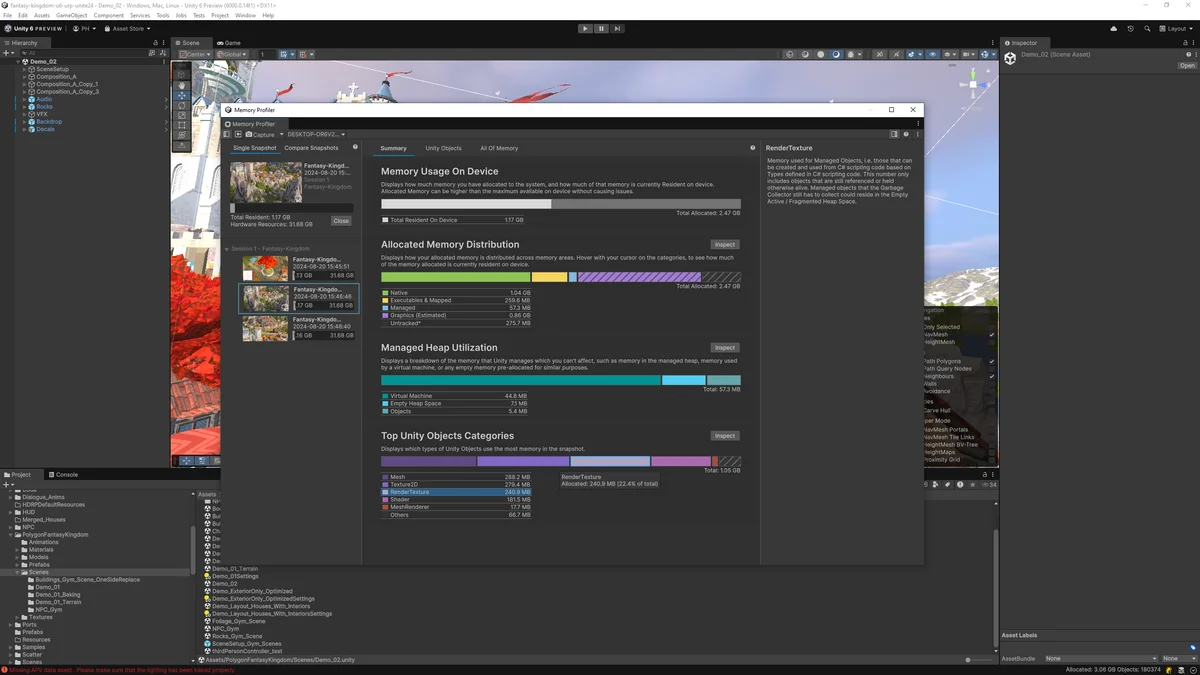
Unity Resources Compare memory snapshots from a running buildFollow Unity’s walkthrough to find large allocations and check whether memory grows across scenes.