See where memory goes
Memory Profiler helps teams find what uses memory in their game.
Unity 6.0
Memory Profiler guide LTS · Long-term supportSupported now
What changed
Unity feature: Memory Profiler
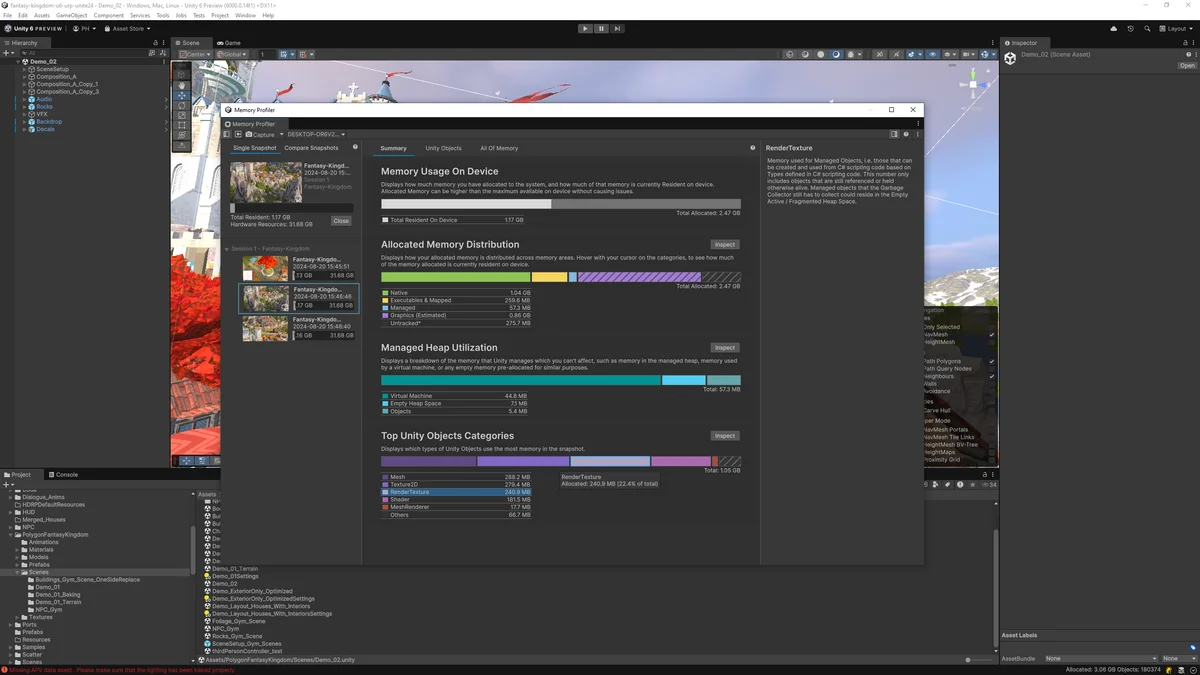
Memory Profiler captures snapshots that show allocations and the objects retaining them. Comparing snapshots helps identify growth between two points in a game session.
Use it
- Install Memory Profiler and capture a snapshot from the Editor or a connected Player.
- Inspect the memory categories and reference chains, or compare two snapshots to find allocations that remain.
Requirements and limits
- A snapshot pauses the target while collecting data and can be large. Editor memory includes overhead that is absent from a Player build.